


SP5PBE. Warsaw DX Club.
Uncategorised
- Szczegóły
- Kategoria: Uncategorised
Baza znaków SP/SQ prowadzona przez SQ5MX i SP5IDK
Administratorzy SP5PBE
- Szczegóły
- Kategoria: Uncategorised
| Osiągnięcia DXCC/WAZ klubu SP5PBE |  |
Autor: SP5PBE  | |||||||||||||||||||||||||||||||||||||||||||||||||||||||||||||||||||||||||||||||||||||||||||||||||||||||||||||||||||
| Stan na dzień: 2012-09-09 (Pewna ilość kart QSL i zarazem potwierdzeń zaginęła) Stany potwierdzeń na 2m i 70cm nie zostały zweryfikowane. 5BAND WAZ (40 stref na 5 pasmach) zrobiony został w 1986 roku.
| |||||||||||||||||||||||||||||||||||||||||||||||||||||||||||||||||||||||||||||||||||||||||||||||||||||||||||||||||||
- Szczegóły
- Kategoria: Uncategorised
Zarząd Klubu SP5PBE, kontakty
Zygmunt Szumski SP5ELA
prezes, kierownik radiostacji
-
E-mail: sp5ela(at)rf.pl lub Ten adres pocztowy jest chroniony przed spamowaniem. Aby go zobaczyć, konieczne jest włączenie w przeglądarce obsługi JavaScript.
-
Skype: SP5ELA lub SP5PBE
-
Tel. (TP): (+48 22) 669 60 42
-
Tel. GSM: (+48 601) 29 60 42
v-ce prezes ds organizacyjnych, 1-szy operator radiostacji
- E-mail: Ten adres pocztowy jest chroniony przed spamowaniem. Aby go zobaczyć, konieczne jest włączenie w przeglądarce obsługi JavaScript.
- Skype: SP5ES_
- Tel. (+48 22) 625 51 96
- Tel. GSM: (+48 662)190 333
QRA-manager, 2-gi operator radiostacji
- E-mail: Ten adres pocztowy jest chroniony przed spamowaniem. Aby go zobaczyć, konieczne jest włączenie w przeglądarce obsługi JavaScript.
- Skype: SP5DED
- Tel. (+48 22) 679 39 22
- Tel. GSM: (+48 501) 663 111
sekretarz klubu
-
E-mail: sp5xfz(at)gmail.com
-
Skype: SP5XFZ
-
Tel. GSM (+48 608) 619 519
- E-mail: Ten adres pocztowy jest chroniony przed spamowaniem. Aby go zobaczyć, konieczne jest włączenie w przeglądarce obsługi JavaScript.
- Szczegóły
- Kategoria: Uncategorised
|
Deep Solar Minimum |
8.07.2010 |
||
|
|
|||


|
|

A 50-year low in solar wind pressure: Measurements by the Ulysses spacecraft reveal a 20% drop in solar wind pressure since the mid-1990s—the lowest point since such measurements began in the 1960s. The solar wind helps keep galactic cosmic rays out of the inner solar system. With the solar wind flagging, more cosmic rays are permitted to enter, resulting in increased health hazards for astronauts. Weaker solar wind also means fewer geomagnetic storms and auroras on Earth.
A 12-year low in solar "irradiance": Careful measurements by several NASA spacecraft show that the sun's brightness has dropped by 0.02% at visible wavelengths and 6% at extreme UV wavelengths since the solar minimum of 1996. The changes so far are not enough to reverse the course of global warming, but there are some other significant side-effects: Earth's upper atmosphere is heated less by the sun and it is therefore less "puffed up." Satellites in low Earth orbit experience less atmospheric drag, extending their operational lifetimes. Unfortunately, space junk also remains longer in Earth orbit, increasing hazards to spacecraft and satellites.

Above: Space-age measurements of the total solar irradiance (brightness summed across all wavelengths). This plot, which comes from researcher C. Fröhlich, was shown by Dean Pesnell at the Fall 2008 AGU meeting during a lecture entitled "What is Solar Minimum and Why Should We Care?"
A 55-year low in solar radio emissions: After World War II, astronomers began keeping records of the sun's brightness at radio wavelengths. Records of 10.7 cm flux extend back all the way to the early 1950s. Radio telescopes are now recording the dimmest "radio sun" since 1955: plot. Some researchers believe that the lessening of radio emissions is an indication of weakness in the sun's global magnetic field. No one is certain, however, because the source of these long-monitored radio emissions is not fully understood.
All these lows have sparked a debate about whether the ongoing minimum is "weird", "extreme" or just an overdue "market correction" following a string of unusually intense solar maxima.
"Since the Space Age began in the 1950s, solar activity has been generally high," notes Hathaway. "Five of the ten most intense solar cycles on record have occurred in the last 50 years. We're just not used to this kind of deep calm."
Deep calm was fairly common a hundred years ago. The solar minima of 1901 and 1913, for instance, were even longer than the one we're experiencing now. To match those minima in terms of depth and longevity, the current minimum will have to last at least another year.
 In a way, the calm is exciting, says Pesnell. "For the first time in history, we're getting to see what a deep solar minimum is really like." A fleet of spacecraft including the Solar and Heliospheric Observatory (SOHO), the twin STEREO probes, the five THEMIS probes, Hinode, ACE, Wind, TRACE, AIM, TIMED, Geotail and others are studying the sun and its effects on Earth 24/7 using technology that didn't exist 100 years ago. Their measurements of solar wind, cosmic rays, irradiance and magnetic fields show that solar minimum is much more interesting and profound than anyone expected.
Above: An artist's concept of NASA's Solar Dynamics Observatory. Bristling with advanced sensors, "SDO" is slated to launch later this year--perfect timing to study the ongoing solar minimum. [more]
Modern technology cannot, however, predict what comes next. Competing models by dozens of top solar physicists disagree, sometimes sharply, on when this solar minimum will end and how big the next solar maximum will be. Pesnell has surveyed the scientific literature and prepared a "piano plot" showing the range of predictions. The great uncertainty stems from one simple fact: No one fully understands the underlying physics of the sunspot cycle.
Pesnell believes sunspot counts will pick up again soon, "possibly by the end of the year," to be followed by a solar maximum of below-average intensity in 2012 or 2013.
But like other forecasters, he knows he could be wrong. Bull or bear? Stay tuned for updates.
Author:Ten adres pocztowy jest chroniony przed spamowaniem. Aby go zobaczyć, konieczne jest włączenie w przeglądarce obsługi JavaScript. | Credit: Science@NASA
Scientists Predict Big Solar Cycle
December 22nd, 2006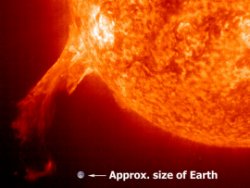
An erupting solar prominence photographed by the Solar and Heliospheric Observatory (SOHO).
Evidence is mounting: the next solar cycle is going to be a big one. Solar cycle 24, due to peak in 2010 or 2011 "looks like its going to be one of the most intense cycles since record-keeping began almost 400 years ago," says solar physicist David Hathaway of the Marshall Space Flight Center. He and colleague Robert Wilson presented this conclusion last week at the American Geophysical Union meeting in San Francisco.
window.google_render_ad();Energy Harvesting Report - www.idtechex.com/energy
Forecasts, players & opportunities new report from IDTechEx analysts
Nanomedicine Conference - www.clinam.org
European Conference for Clinical Nanomedicine. Basel, Apr 27-29,2009
Their forecast is based on historical records of geomagnetic storms.
Hathaway explains: "When a gust of solar wind hits Earth's magnetic field, the impact causes the magnetic field to shake. If it shakes hard enough, we call it a geomagnetic storm." In the extreme, these storms cause power outages and make compass needles swing in the wrong direction. Auroras are a beautiful side-effect.
Hathaway and Wilson looked at records of geomagnetic activity stretching back almost 150 years and noticed something useful:. "The amount of geomagnetic activity now tells us what the solar cycle is going to be like 6 to 8 years in the future," says Hathaway. A picture is worth a thousand words:
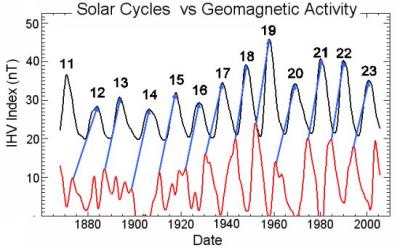
Peaks in geomagnetic activity (red) foretell solar maxima (black) more than six years in advance. Credit: NASA
In the plot, above, black curves are solar cycles; the amplitude is the sunspot number. Red curves are geomagnetic indices, specifically the Inter-hour Variability Index or IHV. "These indices are derived from magnetometer data recorded at two points on opposite sides of Earth: one in England and another in Australia. IHV data have been taken every day since 1868," says Hathaway.
Cross correlating sunspot number vs. IHV, they found that the IHV predicts the amplitude of the solar cycle 6-plus years in advance with a 94% correlation coefficient.
"We don't know why this works," says Hathaway. The underlying physics is a mystery. "But it does work."
According to their analysis, the next Solar Maximum should peak around 2010 with a sunspot number of 160 plus or minus 25. This would make it one of the strongest solar cycles of the past fifty years—which is to say, one of the strongest in recorded history.
Hathaway and Wilson's prediction for the amplitude of Solar Cycle 24. Credit: NASA
Astronomers have been counting sunspots since the days of Galileo, watching solar activity rise and fall every 11 years. Curiously, four of the five biggest cycles on record have come in the past 50 years. "Cycle 24 should fit right into that pattern," says Hathaway.These results are just the latest signs pointing to a big Cycle 24. Most compelling of all, believes Hathaway, is the work of Mausumi Dikpati and colleagues at the National Center for Atmospheric Research (NCAR) in Boulder, Colorado. "They have combined observations of the sun’s 'Great Conveyor Belt' with a sophisticated computer model of the sun’s inner dynamo to produce a physics-based prediction of the next solar cycle." In short, it's going to be intense.
"It all hangs together," says Hathaway. Stay tuned for solar activity.
Source: by Dr. Tony Phillips, Science@NASA
Strona 2 z 2
- start
- Poprzedni artykuł
- 1
- 2
- Następny artykuł
- koniec